
Enterprise-wide spend visibility
One consolidated view across business units, regions and ERPs - no more quarterly data reconciliation projects.
Enterprise-wide visibility into spend, supplier risk and process performance - with savings figures your CFO trusts, because they're tied to real transactions, not spreadsheet estimates.
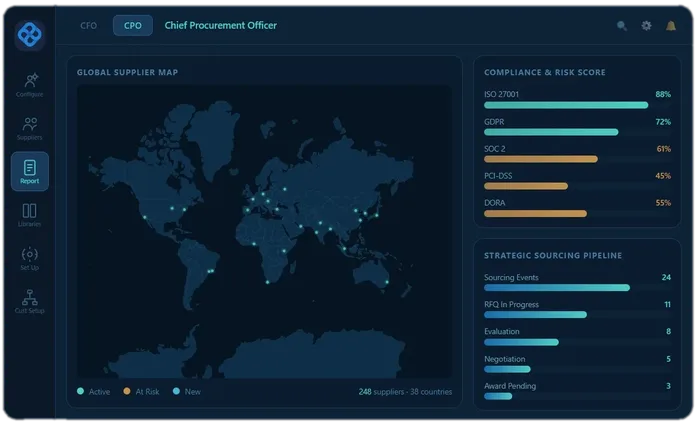
One consolidated view across business units, regions and ERPs - no more quarterly data reconciliation projects.
Policy-aware workflows and full audit trails, so procurement decisions withstand internal and external scrutiny.
Savings tracked to specific sourcing events and validated against baseline - not spreadsheet estimates.
See every unit of spend, classified and benchmarked automatically.
Learn moreFind the savings hiding in your spend data, with results you can defend to the board.
Learn moreContinuous risk monitoring across your enterprise supplier base.
Learn moreA CPO is accountable for two things that pull in opposite directions: a savings number that survives scrutiny, and a function whose capacity is finite. Most procurement organisations are not short of opportunities. They are short of the attention to pursue them, and they spend that attention badly - distributed evenly across categories rather than concentrated where it changes the outcome.
The first problem is credibility. A savings figure built from spreadsheet estimates and category-manager judgement is not a number a CFO can take to a board. Tying savings to specific sourcing events, and those events to the orders and invoices that followed, is what turns a claim into evidence. It is also what makes the number smaller and more defensible, which is usually the right trade.
The second is allocation. Deciding where sourcing capacity goes is a category-strategy question - which categories are price battlegrounds, which are partnerships, which are continuity risks, and which deserve automation rather than attention. Our guide to applying the Kraljic Matrix sets out how that classification is made concrete rather than left on a slide.
Underneath both sits governance. Policy that is published but routinely routed around does not reduce risk; it relocates it. Governance that is enforced at the point of request - so the compliant path is also the easy one - is the only version that shows up in the numbers.
Enterprise-wide spend visibility across business units, regions and ERPs; supplier risk for the exposure view; and orchestration so policy is enforced in the workflow rather than in a manual.
What it does not do. Visibility is not strategy. A consolidated spend view tells you where the money went; deciding what to do about it is still the work, and no dashboard substitutes for it.
Procurement leaders are rarely measured on activity. These are the figures that reach an executive committee, and the part of the platform that changes each.
| What you report | What makes it hard | What moves it |
|---|---|---|
| Realised savings against target | Savings claimed at award rarely survive contact with the invoice, so finance discounts the number. | Strategic sourcing tied through to invoices |
| Spend under management | Spend that never reaches procurement cannot be reported on, and is usually the spend worth having. | Intake management and spend analytics |
| Contract coverage and compliance | Buying outside an agreed contract is invisible until someone audits it. | Source-to-contract and procure-to-pay |
| Cycle time, request to order | The delay is usually waiting for approvals, not sourcing, and nobody measures the waiting. | Approval workflows |
| Supplier risk exposure | Risk is assessed at onboarding and then assumed to hold for years. | Supplier risk management |
Start with how much of your spend is awarded without competition. Three inputs, no sign-up, and a figure you can take into a board pack.