
Benchmark-backed category savings
Benchmark-backed targets across categories, grounded in real market data.
Benchmark-backed targets, structured negotiation playbooks and savings-capture tracking - so identified opportunities turn into realized, auditable results.
Benchmark-backed targets across categories, grounded in real market data.
Opportunities ranked by size, feasibility and time-to-capture.
Savings linked to specific sourcing events, with realized value tracked against baseline.
Auditable savings figures your CFO can stand behind.
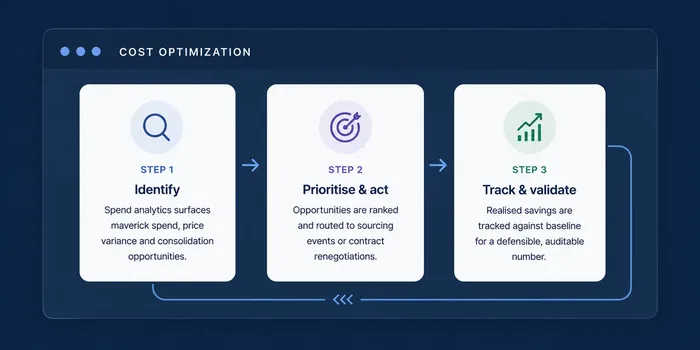
Spend analytics surfaces maverick spend, price variance and consolidation opportunities.
Opportunities are ranked and routed to sourcing events or contract renegotiations.
Realized savings are tracked against baseline for a defensible, auditable number.
In most organisations, cost optimization lives in a spreadsheet. Someone builds a savings pipeline at the start of the year, categories are assigned to owners, and a number is reported to finance each quarter. The spreadsheet is not the problem. The problem is that it is disconnected from the events that create the savings and from the ledger that would prove them, so the reported figure and the realized figure drift apart with nobody able to say exactly where.
The gap has a predictable shape. A negotiated rate is agreed but never reaches the purchase order, because the buyer raising the requisition could not see the contract. A saving is counted against last year's price when finance expected it measured against budget. A category is re-sourced but volume moves to a supplier outside the agreement. None of these are failures of negotiation. They are failures of the chain between the negotiation and the transaction.
Running identification, action and validation on the same platform as sourcing, contracts and purchasing closes that chain. An opportunity is linked to the sourcing event that pursued it, the event to the contract it produced, and the contract to the orders raised against it. When finance asks how much of the pipeline landed, the answer is a query rather than a reconciliation exercise.
Who uses it. Category managers run the pipeline day to day; the CPO uses it to decide where effort goes next quarter; finance uses it to agree what counts as a saving before the year starts rather than arguing about it afterwards.
What it connects to. Opportunities are sourced from spend analytics, pursued through sourcing events, fixed in contracts, and validated against purchase orders and invoices in Procure-to-Pay. Baselines are agreed once and reused, so the same category is not measured three different ways in three different reviews.
What it does not do. It will not decide your category strategy. A savings pipeline built on a weak classification will chase price on categories where price is the wrong lever, and leave leverage categories under-worked because nobody flagged them. That is a strategy problem, not a tooling one, and it is worth resolving before a savings target is set rather than after it is missed.
We'll look for it with you - or estimate your potential savings right now.